Getting Started with Your Gantt Chart Planner
Introduction
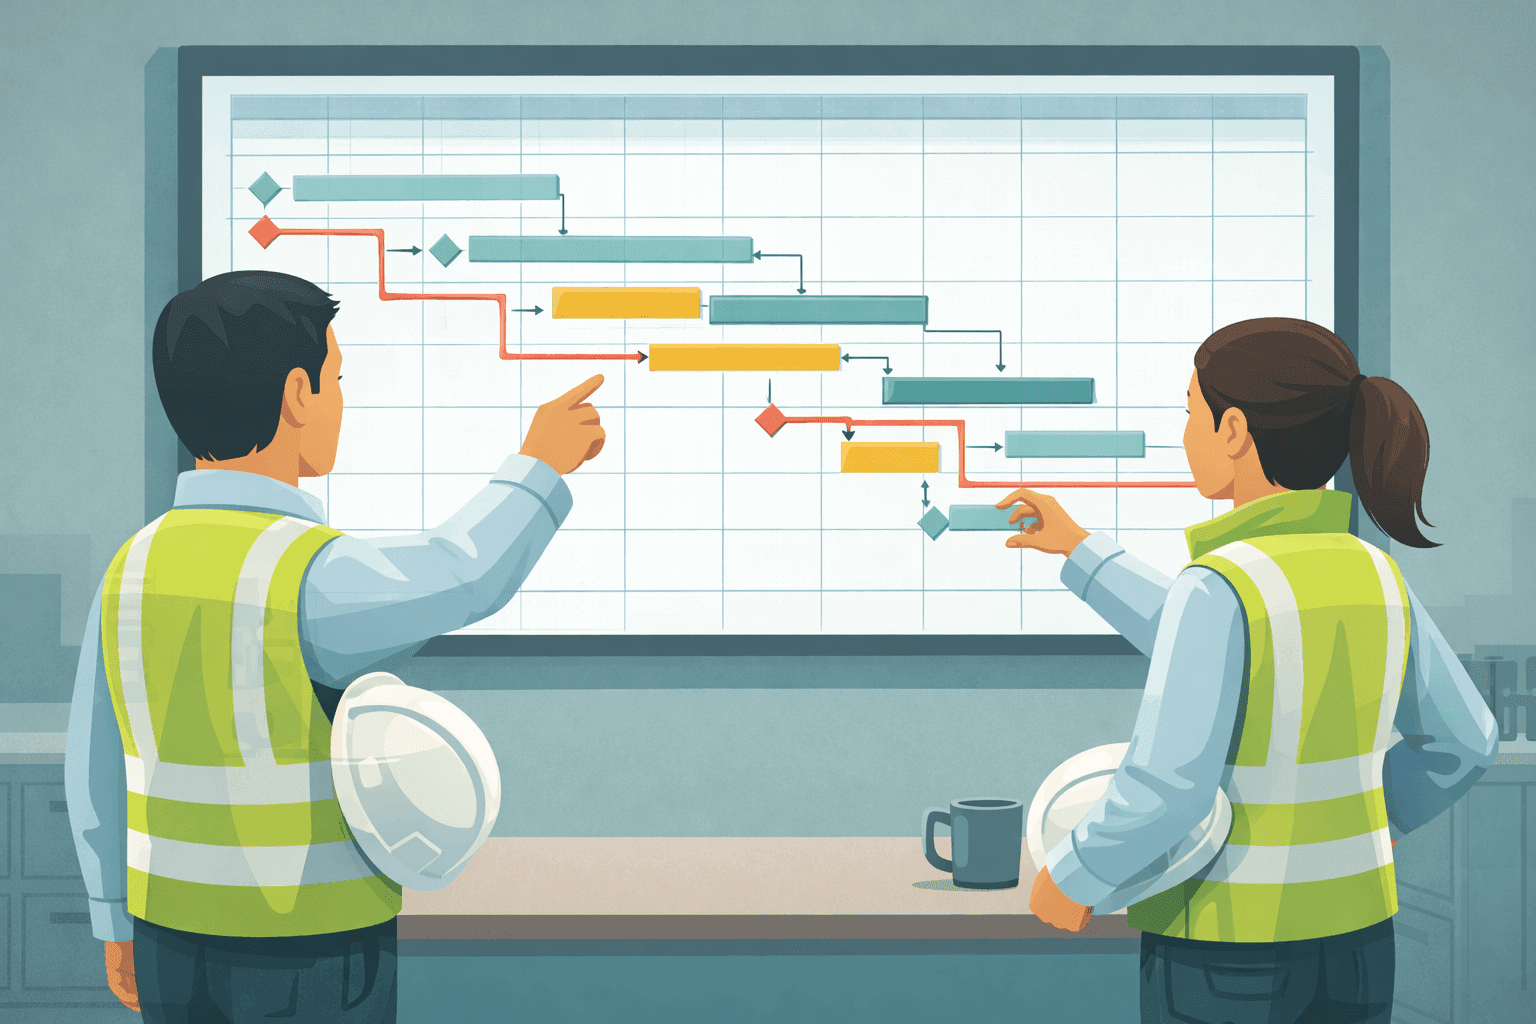
If there is one document that defines how a construction project is managed, it is the programme. And the most common format for a construction programme is the Gantt chart — a horizontal bar chart that shows tasks plotted against time, giving everyone from the site manager to the client a clear visual picture of what should be happening and when. Whether you are planning a small refurbishment or a multi-phase infrastructure project, understanding how to build and maintain a Gantt chart is a fundamental skill.
In this tutorial we walk through the process of creating a construction programme using an Excel-based Gantt chart planner. We cover everything from the initial setup of project phases through to updating progress and presenting the finished programme in meetings. By the end of this guide you will have a working, professional-looking programme that you can use to manage your project with confidence.
Step 1: Define Your Project Phases
Before you start entering individual tasks, you need to establish the high-level structure of your project. Construction projects are typically broken down into phases that represent major stages of work. A common phase structure for a building project might include Preconstruction, Enabling Works, Substructure, Superstructure, Building Envelope, Mechanical and Electrical First Fix, Internal Finishes, Mechanical and Electrical Second Fix, Commissioning, and Handover and Defects.
In your Gantt chart planner, enter each phase as a summary row. These rows will act as headings that group the detailed tasks beneath them. Most planners allow you to format summary rows differently — typically in bold with a shaded background — so that the phase structure is visually clear even when the chart is zoomed out. Getting the phase structure right at this stage is important because it determines how the rest of the programme is organised. Think about how your team naturally talks about the project and use language that everyone will recognise.
Step 2: Add Tasks and Durations
Within each phase, list the individual tasks that need to be completed. Be specific enough to be useful but not so granular that the programme becomes unmanageable. A good rule of thumb for most construction projects is that individual tasks should have durations between one day and four weeks. If a task is longer than four weeks, consider breaking it into sub-tasks. If it is shorter than a day, consider combining it with related activities.
For each task, enter a description, a planned start date, and a duration in working days. The planner will calculate the end date automatically. When estimating durations, draw on your own experience, input from your subcontractors, and any benchmarking data you have from previous projects. Be realistic — optimistic programmes cause more problems than they solve. It is better to have a programme that you can beat than one that puts you under pressure from day one. Remember to account for lead times on materials, curing periods for concrete, and any seasonal constraints that might affect the work.
Step 3: Create Dependencies Between Tasks
Tasks on a construction project do not happen in isolation. You cannot start plastering until the blockwork is complete and checked. You cannot begin mechanical second fix until the walls are lined. These relationships between tasks are called dependencies, and defining them accurately is what turns a simple task list into a genuine programme.
The most common type of dependency is Finish-to-Start, which means that Task B cannot start until Task A has finished. In your Gantt chart planner, you typically define a dependency by entering the row number or task ID of the predecessor in a designated column. Some planners also support Start-to-Start dependencies (Task B starts when Task A starts), Finish-to-Finish dependencies (Task B finishes when Task A finishes), and lag times (Task B starts a specified number of days after Task A finishes). For most construction programmes, Finish-to-Start with occasional lag is sufficient. Take your time with this step — the dependencies are the logic of your programme, and incorrect logic leads to unrealistic dates and missed milestones.
Step 4: Identify the Critical Path
Once you have entered all your tasks and dependencies, you can identify the critical path. The critical path is the longest continuous sequence of dependent tasks through the programme. It determines the minimum possible duration of the project — if any task on the critical path is delayed, the overall completion date moves out by the same amount. Tasks that are not on the critical path have float, meaning they can be delayed by a certain amount without affecting the project end date.
In many Excel-based Gantt chart planners, the critical path is highlighted automatically in a different colour, typically red. If your planner does not do this, you can identify it manually by looking for the chain of tasks with zero float — the tasks where the earliest start date equals the latest start date. Understanding the critical path is essential for effective project management because it tells you where to focus your attention. If you have limited resources and need to decide which activities to prioritise, the answer is almost always the ones on the critical path.
Step 5: Add Milestones
Milestones are significant events or deadlines that have zero duration. They mark key points in the programme such as planning approval, client sign-off on design, structural completion, watertight envelope, practical completion, or sectional handovers. In a Gantt chart, milestones are typically shown as diamond symbols rather than bars.
To add a milestone in your planner, create a task with a duration of zero days. The planner will display it as a milestone marker on the chart. Milestones serve several purposes: they provide clear targets for the team to work towards, they create natural review points for progress meetings, they are often tied to contractual obligations or payment triggers, and they give clients and stakeholders a simple way to understand where the project stands without having to read the full programme. Include milestones for every contractually significant date and for any internal deadlines that the team needs to be aware of.
Step 6: Resource Allocation Basics
A programme tells you what needs to happen and when, but it does not automatically tell you whether you have the resources to make it happen. Resource allocation is the process of assigning people, equipment, and materials to tasks and checking that the plan is actually achievable. In its simplest form, this means adding a column to your Gantt chart for the responsible subcontractor or trade, and then reviewing the programme to check that no trade is being asked to work in two places at once.
For more detailed resource planning, some Gantt chart templates include a resource histogram — a bar chart below the main programme that shows the total number of operatives or the total labour hours planned for each week. If the histogram shows a spike that exceeds your site capacity, you know you need to either re-sequence the work or arrange additional resources. Even a simple resource check can prevent major problems. There is no point having a programme that looks perfect on paper if it requires your electrical subcontractor to have thirty operatives on site during a week when they can only provide fifteen.
Step 7: Update Progress Regularly
A programme is only useful if it reflects reality. The best Gantt chart in the world becomes worthless if it is not updated regularly. Establish a routine — ideally weekly — for recording progress against each task. In most Excel-based planners, you update progress by entering a percentage complete for each task. The planner then shows a filled portion of the bar to indicate how much of the task has been done, and some planners also show a vertical line for the current date so you can instantly see which tasks are ahead, on track, or behind.
When updating progress, be honest. It is tempting to record tasks as ninety percent complete when the reality is closer to sixty, but this only delays the moment when you have to confront the problem. If a task is behind programme, record it accurately and then decide what action to take: can you add resources, re-sequence downstream tasks, or accept the delay and adjust the end date? Regular honest updates turn the programme from a static document into a living management tool. They also create a valuable historical record that you can use for planning future projects.
Step 8: Present the Programme to Clients and Stakeholders
A construction programme is not just an internal management tool — it is a communication device. You will present it in client meetings, contractor coordination meetings, design team workshops, and progress reviews. How you present the programme matters almost as much as the content.
For client presentations, simplify the view. Collapse the detailed tasks and show only the phase-level summary bars and the key milestones. Clients do not need to see every individual task — they want to know the major dates, the overall sequence, and whether the project is on track. Most Gantt chart planners allow you to filter or hide detail rows for this purpose. Use colour consistently: one colour for completed work, another for on-track tasks, and a third for tasks that are behind programme. Add a title block with the project name, the programme revision number, and the date of the update.
For internal team meetings, show the full detail for the next two to four weeks — the look-ahead period — and keep the rest at summary level. This focuses the discussion on what needs to happen right now rather than getting lost in activities that are months away. Print the look-ahead section or display it on screen during the meeting, and use it to assign actions and confirm dates with each subcontractor.
If you are submitting the programme as a contract document, check the specification for any required format. Some clients and main contractors require specific software formats, but many will accept an Excel-based programme provided it is clear, logical, and includes all the required information such as task descriptions, durations, dependencies, milestones, and the critical path. Export to PDF for formal submissions to ensure the formatting is preserved regardless of what software the recipient uses.
Tips for Getting the Most Out of Your Gantt Chart
To conclude, here are a few additional tips that will help you get the most from your Gantt chart planner. First, keep the task list manageable. A programme with five hundred lines is difficult to maintain and even harder to communicate. For most construction projects, one hundred to two hundred tasks is the sweet spot. Second, review the programme with your supply chain before you issue it. Subcontractors often have insights into sequencing and durations that the main contractor's planner does not. Third, save a baseline copy of the programme before the project starts. This allows you to compare the current programme against the original plan and quantify any delays or changes. Fourth, keep a revision log so you can track when and why the programme was changed.
Finally, remember that the programme is a tool, not a target. Its purpose is to help you manage the project effectively, coordinate the work of multiple trades, and communicate the plan to everyone involved. A programme that is realistic, well-maintained, and clearly presented will earn the trust of your client, your supply chain, and your own site team. That trust is the foundation of a successful project. Open your Gantt chart planner, start entering your phases and tasks, and build a programme that you and your team can deliver with confidence.
Build Better Sites with Our Templates
The templates and systems discussed in this article can save your team hours every week. Explore our full product range to find tools that match your workflow.
Explore Products